In a recent series of papers, the first of which is available here: https://arxiv.org/abs/2309.13115, we present the first-ever cosmological simulations that follow how material gets “all the way down” from cosmological scales to fuel/power super-massive black holes and quasars.
This represents the culmination of several years worth of work from two different large theory collaborations led by current and former students and postdocs from our group: one our “FIRE” collaboration (simulating how galaxies form from cosmological/large-scale initial conditions, the other “STARFORGE” collaboration led by former Caltech grad student Mike Grudic with collaborators David Guszejnov, Stella Offner, Anna Rosen, and many others, simulating the “small-scale” physics of how individual stars form and how gas moves around in the interstellar medium. Combining all these physics and new numerical methods into one code, we were able to follow how gas gets down from scales of millions of light years away from galaxies down into the galaxies, through the galaxies into their nuclei, all the way down to form the accretion disk around the super-massive black hole powering a quasar comparable to the most luminous we see.
In terms of resolution, its more than a thousand times improvement over the previous “best-ever” in the field. But the real qualitative leap-forward here is in the physics - we follow explicit effects of radiation-matter coupling across a range of wavelengths, magnetic fields, star formation and stellar feedback in the form of supernova explosions, winds, protostellar jets, and radiation, all fully “live” and dynamical in a cosmological setting. And not only is it the first time we’ve been able to see such a disk form from “first principles” so to speak, but the disk properties turn out to be wildly different from our “standard model” for the accretion disks fueling quasars (which has been largely unchanged in the last 50 years since it was proposed in 1973). We see things like magnetic fields and densities different by factors of millions to hundreds of millions compared to the “textbook” model predictions, which can explain a lot of decades-old puzzles that were left unexplained in those models. And of course, pretty pictures and movies! The papers have some amazing images to go with their science content, of course, and here we have the first couple animations of these simulations.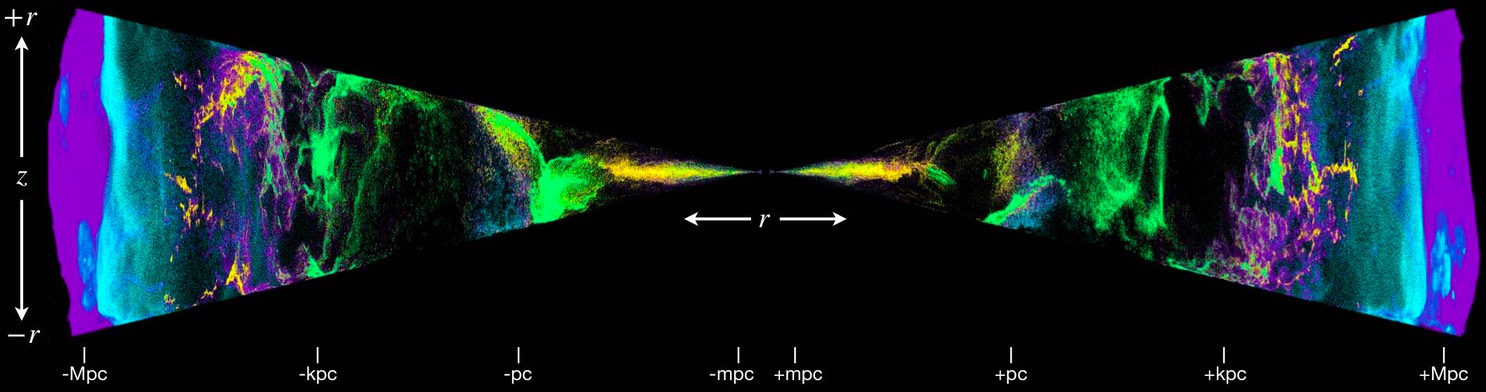
Animations:
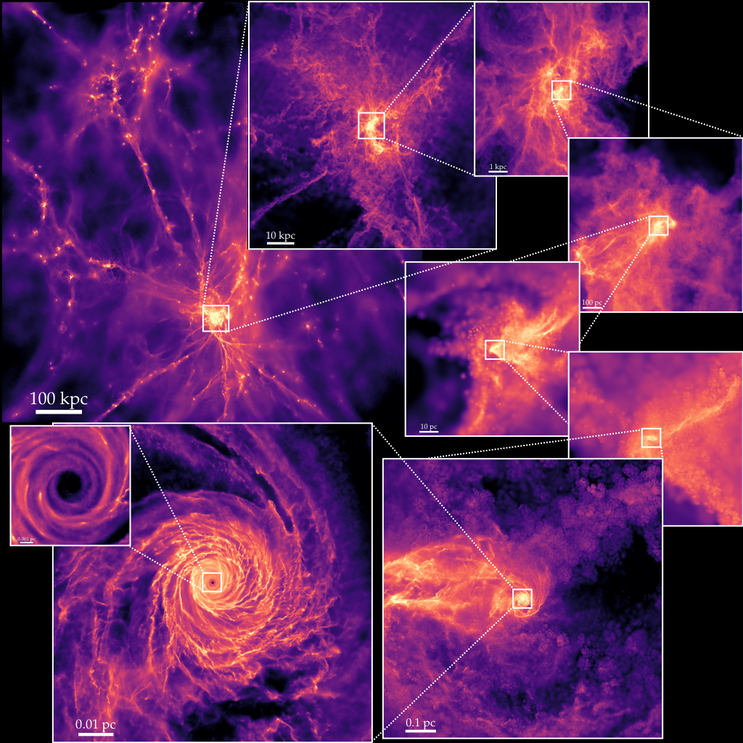
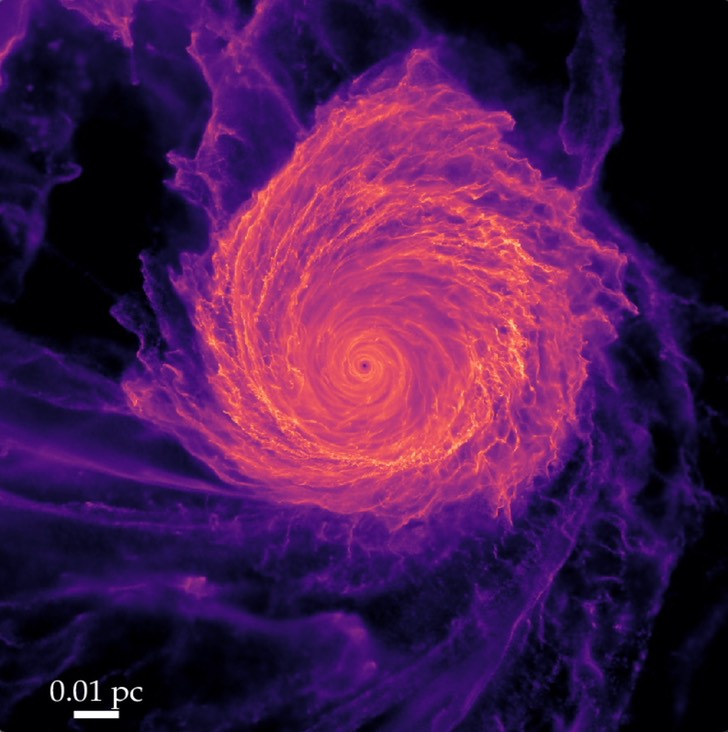
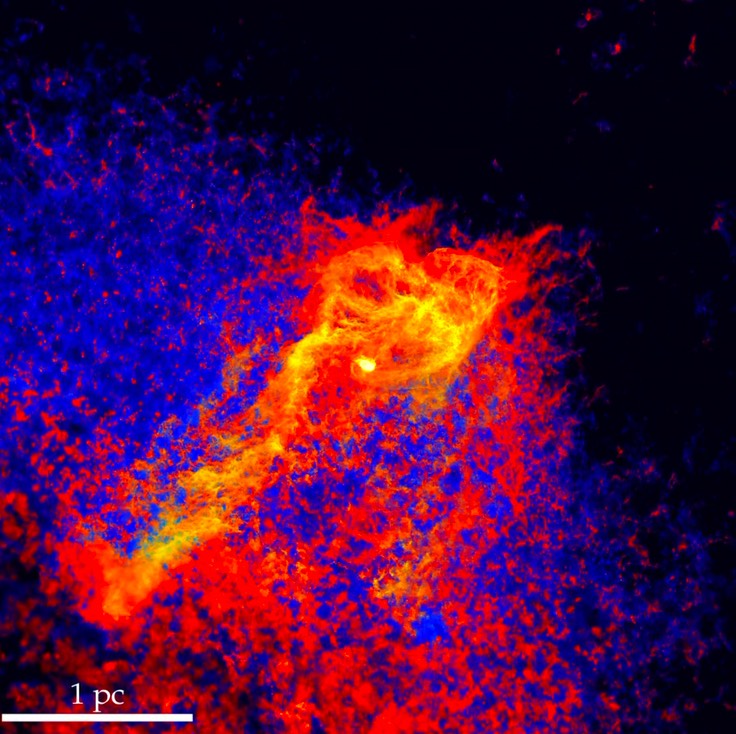
The animation at left here shows a “fly-in” of one of the simulations, at one moment in time. We start from millions of light years away from the galaxy, and “fall in” towards the galaxy and its central super-massive black hole, until we nearly reach the resolution limits of the simulation at <80 au, smaller than the size of our solar system. You can see the complicated, clumpy, merging galaxy — a high-redshift, massive galaxy undergoing multiple mergers — which has a giant molecular-cloud-like complex of gas being disrupted by enormous tidal forces into a filamentary “stream” falling into the black hole at small scales, which gets “wound up” into the quasar accretion disk. This is funneling gas in at a rate sufficient to fuel the brightest known quasars in the Universe. The scales in the simulation are labeled as we zoom in by a factor of a billion in size. The colors show the density of gas in the galaxy (brighter is more dense).
Next, this movie (right) shows the same “falling in”, but the colors now encode something different: they represent the ratio of magnetic pressure to thermal pressure (a key quantity for understanding how a plasma behaves). The blue colors represent gas where the thermal pressure is larger than the pressure forces exterted by magnetic field lines. The red regions represent where the magnetic fields dominate the pressure. On the largest scales, the magnetic fields are relatively weak. On intermediate scales, you can see a lot of back-and-forth with cold, dense clouds dominated by magnetic fields surrounded by diffuse, warmer gas dominated by thermal pressure. But notably, in the center, in the accretion disk in particular, the magnetic fields are vastly stronger than thermal pressure throughout — in stark contrast to the fundamental assumption of decades of modeling of accretion disks.
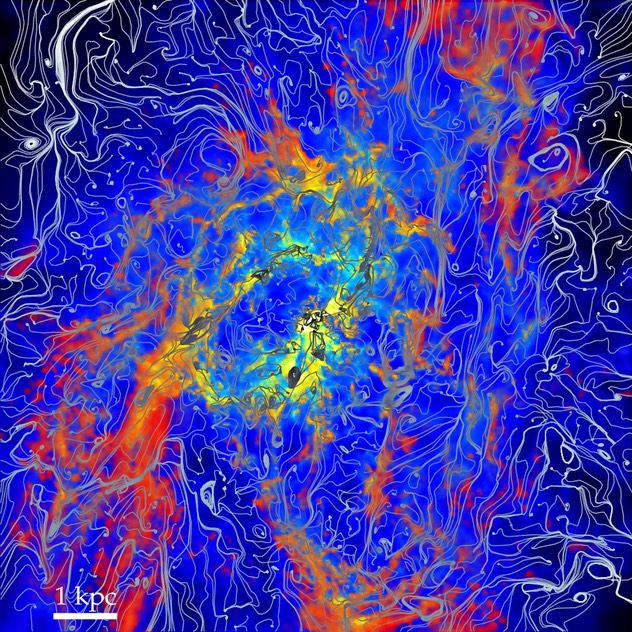
At left here, we have a movie of the same color scales, but overlay the magnetic field streamlines. You can see the clear transition from fields which are disordered, a result of the “turbulent” dynamo driving their amplification and structure, on the largest scales, to field lines being stretched with the gas into a radial and then toroidal (i.e. azimuthal or rotation-like) configuration as gas falls into and “wraps around” the black hole to form the accretion disk on small scales.
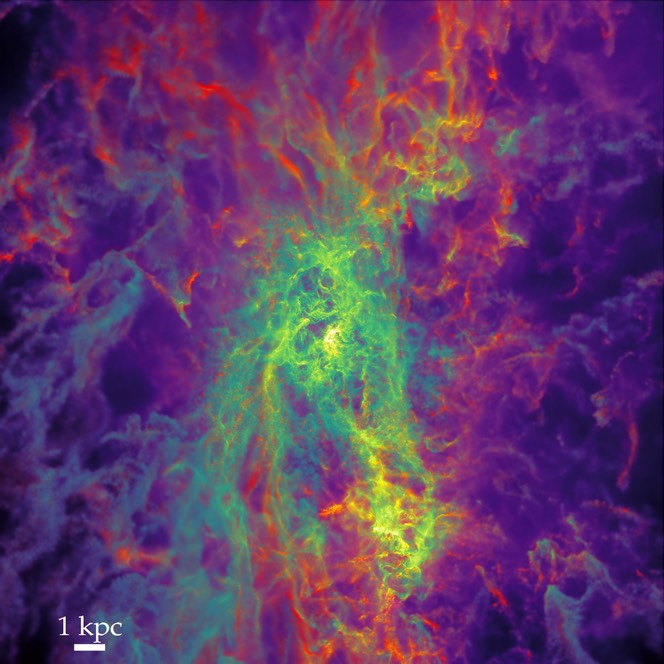
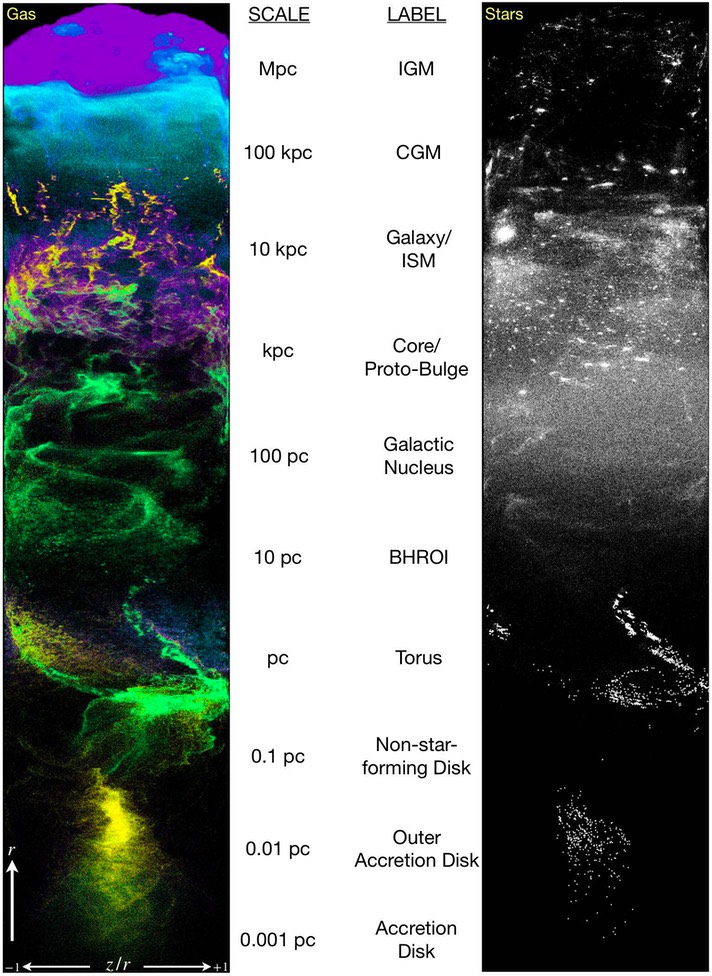
Now the movie at right here shows a similar “infall”, but with colors now encoding different information again. The green-blue color palette denotes gas in which the pressure forces primarily come from local turbulence or “ram pressure” (i.e. the motions or kinetic energy of the gas). The purple-magenta palette denotes gas which is primarily dominated by thermal energy. And the red-yellow palette denotes gas where magnetic pressure forces are most important of the three. We see that there are hot “bubbles” on large scales where thermal pressure dominates, with a large intermediate-scale range in the galaxy and nucleus where turbulence is most important, until we approach the accretion disk and magnetic fields take over.
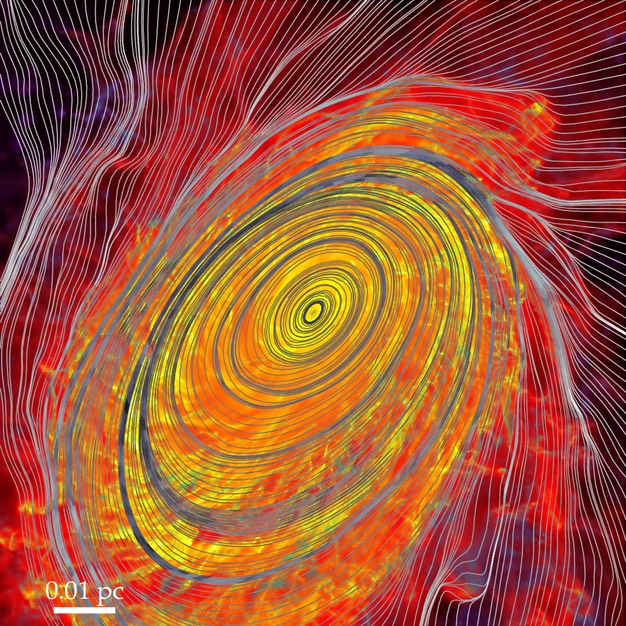
This movie (left) shows the same three-color map as above denoting where the pressure comes primarily from turbulence or magnetic fields or thermal gas motions. But we overlay the velocity field lines (like the magnetic field lines above, but now showing the velocity flow pattern). You can more clearly see outflow structures and inflow into cosmic web filaments and then the galaxy, a highly turbulent interstellar medium, with the streamlines showing how the massive cloud complex near the center is being tidally extended and “shredded”, and then gas free-falling onto the central supermassive black hole until it winds up into the accretion disk.
More pictures and animations to come as we update the series of papers, stay tuned!
For comparison, you can look at our group’s older “Previous-Generation" work on “Zooming in” Around an accreting black hole:
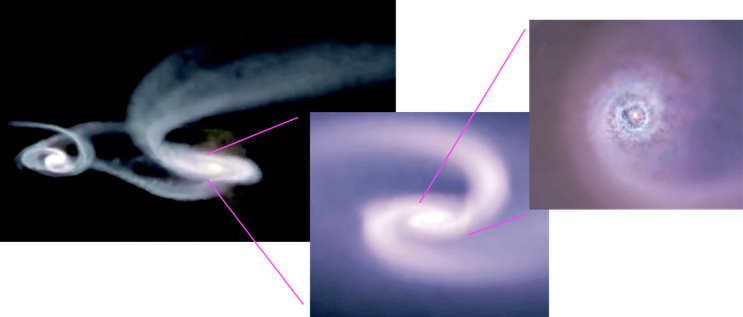
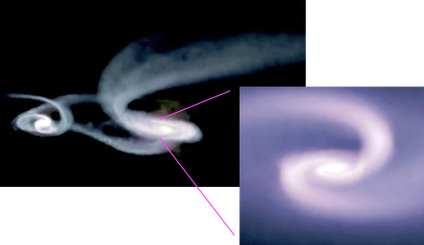
These movies show typical results of previous-generation “zoom-in” simulations, following the gas that falls to galaxy centers in a major merger all the way down until it is accreted by a super-massive black hole. The largest-scale simulations begin with galaxy-galaxy mergers; these mergers funnel gas into the central regions of the galaxies, raising its density by a factor of ~100-1000. Because of the huge dynamic range in the problem, it was impossible at the time these simulations were run (just a few years ago) to resolve the small-scale physics around the black hole at the same time as the large-scale galaxy collision, let alone to include the wealth of different physics described above. So these older simulations used a more simplified approach — the physics of the interstellar medium was approximated with a simple “effective equation of state” (which is why you can’t see the same kind of structure here as in the movies above, all those important details are missing), and magnetic fields and radiation aren’t evolved (which turns out to make a really big difference in the actual quasar accretion disks!). But we could, with these approximations, “zoom in” on these central conditions (scales of ~10pc - 1kpc, or 30-3000 light-years), and re-simulate them at somewhat higher resolution. The “intermediate” scale simulations above show examples of this, given some slightly different initial conditions. The gas densities build up so high that they are vulnerable to global gravitational instabilities, forming features like bars, rings, and spirals, that channel gas to yet further radii. Continuing this re-simulation technique, we can follow gas down until it forms a nuclear disk at ~1-10pc or 3-30 light-year scales. This provides further structure that moves the gas down yet further, to a tenth of a parsec (0.1pc), where a traditional quasar accretion disk forms (still true in the more sophisticated simulations shown above), carrying the material down to the supermassive black hole. This cascade of gravitational instabilities can fuel the black hole at rates of up to ~10 solar masses per year, in these simulations (giving luminosities comparable to the brightest observed quasars in the Universe, up to redshifts z=6). The new-generation simulations above appear to validate these older models for the gas on “larger” scales (outside of ~1 pc or so), but tell us these sorts of models can’t really be extrapolated reliably to smaller scales. So for the range of scales here, the key insights about how gravity and stars interact appear to hold up!
The movie shows the galaxy gas, followed over a series of scales from a galaxy merger down to a central super massive black hole (see description below).
Color shows the effective turbulent motions (sound speed) in the gas, from ~10 km/s (blue) to ~100 km/s (yellow)
Brightness shows the projected gas surface density, scaled logarithmically.
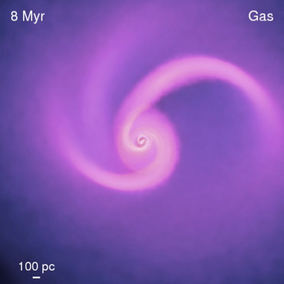
The simulation shows the re-simulated central (~10-1000 pc) regions of a galaxy merger, at a stage where central gas densities are high, and the system forms a clumpy spiral instability. It continues to zoom in.
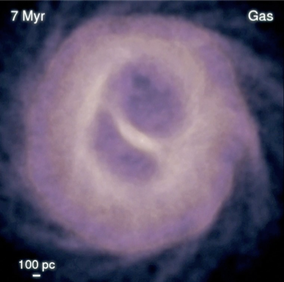
The simulation shows the re-simulated central (~10-1000 pc) regions of a galaxy merger, at a stage where central gas densities are relatively low, but inflow piles up in a ring that soon collapses. It also continues to zoom in.
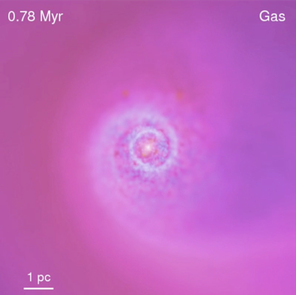
The simulation shows the re-simulated very nuclear regions (~0.1-50 pc), following from the above “spiral” conditions. A nuclear, lopsided disk forms that drives bright quasar activity.